|
|
| (83 intermediate revisions by 7 users not shown) |
| Line 1: |
Line 1: |
| Written by Mica Pollock, Jedd Cohen, Josh Wairi, and Seth Woodworth for the dashboard project | | ''Written by Mica Pollock and Jedd Cohen for the dashboard project, with initial dashboard development by Somerville technologist Seth Woodworth and next development for piloting by David Lord of San Diego |
|
| |
|
| As we documented this project, we thought about OneVille's project-wide questions:
| | Click here for the '''[[Overview and key findings: Data dashboards|<font color=#0000FF>Overview and key findings</font>]] '''on this project; click here for the '''[[Expanded story: Data dashboards|<font color=#0000FF>Expanded story</font>]] '''on this project. |
|
| |
|
| ''Who needs to communicate what info to whom, in order to support young people?
| | ===What communication challenges did this project address?=== |
|
| |
|
| ''Which barriers are in the way of such communication, and how might these barriers be overcome? Which media might help?
| | In diverse districts across the country, administrators, teachers, and approved service providers are often unable to quickly review patterns in basic data affecting students – like trends in their absences, test scores, grades, and credits. This is often due to the high cost of cutting-edge student data systems (or, the high cost of professional development showing educators how to use the systems they have). Families, for their part, are often unsure how to find all the relevant data on their children, how to read data once they are given it (e.g., a report card), and how to communicate with schools about it. (see http://nationalpirc.org/engagement_webinars/webinar-student-data.html). As both educators and parents know, gaps in available basic data also can create gaps in student service, because people in charge of supporting young people remain unaware about some key aspects of their situation. How are speakers of language X doing on standardized tests? Who is enrolled in which afterschool program? Was Jose's absence rate over the past semester unusual? |
|
| |
|
| ''How might basic tech help increase community cooperation in young people’s success, by supporting diverse students, teachers, parents, administrators, service providers, and other community members to share ideas, resources, and information and to build relationships?
| | In Somerville in 2009, teachers and administrators said they couldn’t easily view or sort patterns in student data because that data was buried in different “fields” in the student information system (SIS), which Somerville couldn’t afford to replace or fundamentally upgrade. Over the past two years, several local technologists, a teacher, and several researchers have been working with the teachers' families, related afterschool providers, and two principals in the Somerville School District to help design and create "dashboard" tools using open source software (free software that any developer can adapt). |
|
| |
|
| ==Summary==
| | A "dashboard" is a quick, visually simple view of student data, all in one place. Our "dashboards" are designed to let (appropriate) viewers go to a single place – on the web – to find and sort comprehensive data on each student, class of students, and the entire school. Particularly in designing our "individual view" (which would display an individual student's data to student, parent, teacher, and approved service providers), we’ve been working to design a tool that not only displays basic data on students, but also launches a focused conversation among stakeholders about that data. |
|
| |
|
| '''(A bird’s eye view for the quick reader. We're addressing these questions:)
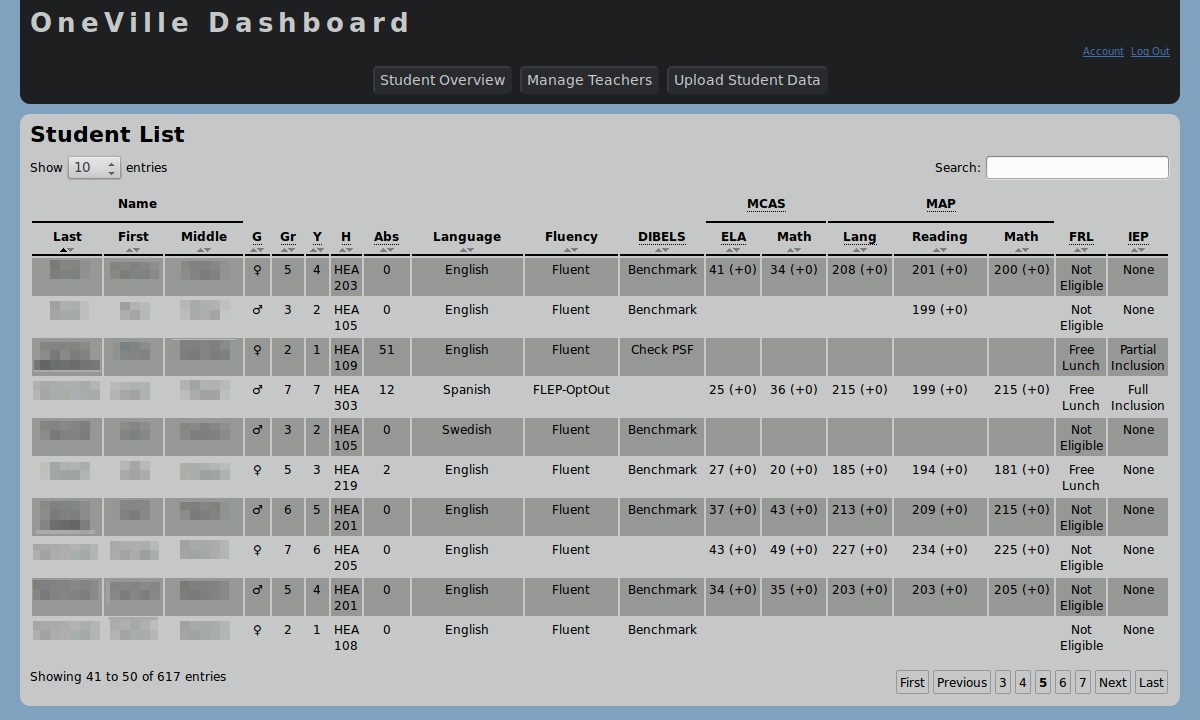
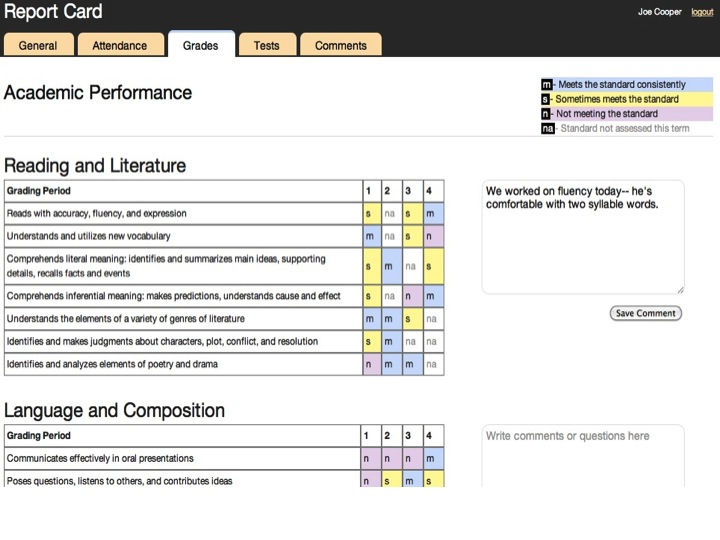
| | The first dashboard below (our "administrator" and "teacher" view) shows educators data on a school or classroom of students. The "individual view" dashboard beneath it shows data on an individual student to student, teachers, parents, and approved afterschool providers. This view also allows these people to communicate with each other through the “comment boxes.” (Names are fictional to preserve anonymity.) |
|
| |
|
| ''a. What communication did we hope to improve, change, or create? Why?
| | [[Image:Admin Dash 2012-01-25.jpg|Admin Dash 2012-01-25.jpg]] |
|
| |
|
| ''b. Main efforts, and concrete communication improvement(s). (Who was involved in the project and how was time together spent? What did the project accomplish? How did communication improve? What new support for young people may have become more possible?)
| | [[Image:IndivDashSummary.jpg|IndivDashSummary.jpg]] |
|
| |
|
| ''c. Main realizations. (At this point, what's our main realization about improving communications in public education? (We'll say a few overall words in response to OneVille's research questions, above!) | | On the OneVille Project, the dashboard was one of six subprojects and our first effort to create a tech tool totally from scratch with young local technologists. Development with our Somerville colleagues took more budgeted hours than any of us originally anticipated, and after some excellent pro bono work by David Lord of San Diego, by Spring 2012 we were about 60 development hours from pilot-readiness on the admin and teacher views (and roughly 300 hours from pilot-readiness on the individual view). Remaining work: to finish tweaking the final programming "tubes" linking the dashboard to Somerville's Student Information System so that data could be displayed 100% glitch-free. The "code" for all of the dashboard views is linked on the '''[[Overview and key findings: Data dashboards|<font color=#0000FF>Overview and key findings</font>]] ''' page and to date is the core "product" of this pilot. Open source code also means that any developer anywhere can develop on the product we made. For example, community youth-serving and university outreach orgs needing to view and sort youth- and student-related data have expressed interest in a similar free product developed for their specific needs. See the '''[[Overview and key findings: Data dashboards|<font color=#0000FF>Overview and key findings</font>]] ''' and '''[[Expanded story: Data dashboards|<font color=#0000FF>Expanded story</font>]] ''' pages for the full story of developing this tool. |
|
| |
|
| -----------------
| | ===Why is it important to improve communications?=== |
| With teacher Josh Wairi, principals Jason DeFalco and then Purnima Vadhera, parents, and students at the K-8 Healey School in Somerville, and young local technologists, we have worked to create an open source dashboard -- a data display that sits “on top of” the district’s student information system and displays data in ways that partners (parents, teachers, administrators, students) can quickly view and comment on. By "dashboard," we mean a single place to go to get a quick view -- like the front “dashboard” on your car. But our tools are also designed to support people to communicate about what they see.
| | What we found: |
|
| |
|
| We’ve designed three “dashboard” tools. We started in 2009 by tweaking a great color-coded Excel spreadsheet that Greg Nadeau, a Somerville parent, had made for the Healey principal (see [[Dashboard/ahas]] for specifics). We ended up codesigning an administrator's data view with Healey administrators, and a teacher’s view that presents similar information for a single class of students. Here is the admin view:
| | :*'''<font color=red>¡Aha!</font> A gap in student data equals a gap in service. |
|
| |
|
| [[Image: admin view.jpg|admin view]]
| | :*'''<font color=red>¡Aha!</font> One-Stop Shopping: People say it's crucial to be able to see different kinds of student data at the same time, in a single display -- and, be able to sort that data to check for patterns. |
|
| |
|
| | :*'''<font color=red>¡Aha!</font> Open source data tools could save schools across the country significant costs, IF design goes fast enough, IF community users are ready to use the tools, and IF tech support for open source tools remains available locally. |
|
| |
|
| We also designed an individual view, with additional data, for parents, students, afterschool providers and teachers to communicate in a team about each individual student:
| | :*'''<font color=red>¡Aha!</font> In addition to having the ability to quickly see and sort such basic data, diverse partners in young people’s lives need supports to communicate ABOUT basic data. |
|
| |
|
| | ===How do the dashboards work? How might they be designed?=== |
|
| |
|
| [[Image: individual view.jpg|individual view]] | | :*You can see how we designed our dashboards in '''[[Overview and key findings: Data dashboards|<font color=#0000FF>Overview and key findings</font>]] '''and '''[[Expanded story: Data dashboards|<font color=#0000FF>Expanded story</font>]]'''. |
|
| |
|
| For that view, we built on a data display model from the New Visions schools in New York, combined it with Somerville’s locally designed K-6 report card, and worked with teacher Josh Wairi and his families (with advice from his students and afterschool providers) to integrate everyone’s insights into the testable product!
| | ===How do you know if your school could improve communication?=== |
| | '''Questions to ask about the current system in your school: |
|
| |
|
| Our goal in 2011-12 is to test and tweak these three tools with educators, administrators, families, students, and afterschool providers, and to link these tools electronically so that in any given team meeting, educators have access to all the data at once. We also want to see how they should be designed to support face to face and email-based conversations about “the data.”
| | :➢ To support young people, what “data” should show up on any data display, and why? |
| | :➢ How does your school make data on students visible to school administrators, classroom teachers, and afterschool providers? And how about parents? Which necessary data is readily available, and which isn't? |
| | :➢ What infrastructure would support actual conversations ''about'' "data," between the people who share young people's lives? |
| | :➢ Which conversations about data should happen in person and which could be supported online? Could you do an experiment to test which works for what? |
| | :➢ What data isn’t found in any “student information system” but should still be known? By whom? |
| | :➢ Is your district spending tons of money on data display tools to get basic data in front of people? |
| | :➢ If so, how might low cost tech development or professional development on the tools you already have support such information-sharing? |
| | :➢ ***How can you ensure resources for ongoing tech modifications and tech support after you have developed your initial tool? |
|
| |
|
| Why’d we do this? Well, in education these days, we talk a lot about “data-sharing.” Typically, we mean making sure that educators or afterschool providers can see information on students' demographics and progress as measured with basic numbers (e.g.,: test scores, days absent). These indicators never show "the whole child" ([[ePortfolio|eportfolios]] can help with that!), but they are still very important to know. They show how students are doing on measures that many educators treat as very important (e.g., grades on a report card) and that do tend to predict important events like “dropping out” (e.g., absences from school).
| | === The Next Layer: Connecting to Folks Doing Similar Work in Other Communities.=== |
|
| |
|
| Gaps in available basic data also can create gaps in student service, because people in charge of supporting a young person remain unaware about some key aspects of their situation (was Jose absent, or not?).
| | We'd love to spark a lively exchange between people working on similar things. |
|
| |
|
| In an era when you can log on to any computer and get quick updates from friends, there’s no reason why all the people who need to know basic info in order to serve young people can’t know it immediately!
| | '''Want to talk further? |
|
| |
|
| But most tools for simple data display in schools cost districts a lot of money. And so, many districts don’t have them. To clarify: a typical district has a “student information system” (a database of student information), but many districts don’t have any easy tools for quickly displaying that information to multiple partners at once (or letting them sort the data to see patterns in it). In Somerville, administrators had to send data analysis requests to a central office (filled with great staff!) and the staff would send patterns back to them. Or, teachers have had to create their own Excel spreadsheets or printouts and analyze them by hand.
| | Are you working on improving communications in your own school or community? |
|
| |
|
| When districts do have online data display tools, finally, they typically aren't designed by educators or parents. In fact, families are often unsure how to find all the relevant data on their children, how to read data once they are given it (e.g., a report card) and how to communicate with schools about it. (see http://www.nationalpirc.org/engagement_webinars/webinar-student-data.html)
| | Contact point people for the dashboard project directly at: |
|
| |
|
| Somerville educators were very interested in a “dashboard” and so, this was the main working group on the OneVille Project where we decided to try to make a tool from scratch. We spent Ford funding on supporting local technologists, Seth Woodworth and Evan Burchard, and a 5th grade teacher, Josh Wairi -- all in their late twenties and early thirties -- to design and build a tool that Somerville might eventually be able to use for free, if it worked.
| | Jedd Cohen (jic378@mail.harvard.edu); Mica Pollock (mica.pollock@gmail.com) |
|
| |
|
| '''MAIN COMMUNICATION REALIZATION: Putting info online can put student supporters “all on the same page,” as Josh put it one day: that’s because rather than passing paper folders around, everyone can see the same data at once.
| | Click here for the '''[[Overview and key findings: Data dashboards|<font color=#0000FF>Overview and key findings</font>]] '''on this project; click here for the '''[[Expanded story: Data dashboards|<font color=#0000FF>Expanded story</font>]] '''on this project. |
| | |
| Putting data online also means that more people can join the “team” analyzing the data. When schools and districts have data teams, they typically involve teachers and administrators, not parents; more rarely do afterschool providers, parents, or students themselves communicate about student data they are all seeing at once.
| |
| | |
| '''MAIN COMMUNICATION REALIZATION: A gap in data equals a gap in student services.
| |
| | |
| Principals Vadhera and DeFalco, teacher Josh Wairi, along with various students we talked to in our other pilots, all mentioned instances where a student “fell through the cracks” because of a piece of missing data -- for example, a student who received an unexpectedly poor grade at the end of the semester, with the parent, the homeroom teacher, or the administrator surprised by the news. These main partners also described how seeing new patterns, faster, could support faster interventions -- from MCAS accommodations to targeted academic support.
| |
| | |
| While many communications have to happen in person so that people build trust and share details (a parent-teacher meeting; a student support team meeting), having everyone online can also mean that a group conversation can be sparked at any time. When people rely on paper folders, the person who leaves with the folder leaves with the record of care due the child!
| |
| | |
| At the same time, relying only on tech-based conversations would leave out people with less access to tech (or knowledge of it). And so, improving basic data sharing in education is still about ensuring that all necessary stakeholders are aware of students' most basic situation in a timely manner. That means supporting people to see data quickly instead of sorting through separate folders, and, it means making tech easy and common-denominator rather than complicated; it also means doing things like training parents on email or putting a computer in the PTA room (part of our [[Schoolwide communication toolkit|schoolwide communication]] efforts). And, just "getting data" on a student is never enough: people need to then converse (online, in person, or otherwise) about how the young person is doing and how they might be assisted. Just knowing how many days a child is absent is the first step, but then you need to have a conversation about why and what to do about it!
| |
| | |
| ==Communication we hoped to improve==
| |
| | |
| '''A bit more. What aspect of existing communication did we hope to improve, so that more people in Somerville could collaborate in young people's success? | |
| ------------------------
| |
| Lots of people in Somerville talked about the need to improve data display at the parent/student level, the teacher level, the afterschool provider level, and the administrator level.
| |
| | |
| [[Image:Aspen X2 3.jpg|thumb|Aspen X2 3]] | |
| | |
| In Somerville, older students and parents can log into X2, the student information system, to see updates on their grades, absences, etc. But many don't have passwords or don't know they have them; students told us they often forgot them. More importantly, once they get to X2, some found the data there hard to understand. Information isn't translated for non-English speakers. And viewers can’t comment ON the data seen. X2 is set up only to house student data -- not to help people talk about it. In talking about dashboard prototypes with parents, the major feature everyone emphasized was the ability to immediately comment ON data, rather than simply “look at it.”
| |
| | |
| When you get “into” X2 as a teacher or administrator, you also can’t easily see patterns in student data. Josh had to create spreadsheets for his own class by hand. At the administrator level, the Healey principal was also never able to easily sort any of his data within X2. Doing so requires queries to a busy central office, which runs data analyses and releases data reports once a week. Getting new data during a meeting, for immediate discussion, is not feasible.
| |
| | |
| While some afterschool providers had access to X2 directly, many didn’t, meaning they had trouble knowing basic information like whether students who were coming to afterschool were going to school. So, these providers typically kept their information in separate computer databases or even on paper. In our many discussions with people about basic data issues, they raised a key point:
| |
| | |
| '''COMMUNICATION AHA: It is crucial to be able to see different kinds of student data at the same time, in a single display.
| |
| | |
| For example, afterschool attendance and MAP score changes, or student demographics and achievement data, shouldn’t be scattered in inaccessible places! Supporters need to able to see these basic “indicators” all in one place.
| |
| | |
| So, the goal became to create a simple data display that could help all these folks see some basic data kept in X2 in a single view. This included creating a translated display easily understandable by an immigrant parent. Over time, we also decided that we wanted to co-create tools designed explicitly to help teachers, administrators, parents, and tutors to communicate about the basic data and about students' progress toward standard benchmarks -- not just see it!
| |
| | |
| Our rationale: Many data displays in schools are a) on paper and b) one-way. Think a report card or a quarterly report on one’s “scores”: schools or districts just “display” to kids their scores or show parents their child’s absences. Since OneVille’s goal is to support diverse partners in running communication about pursuing the success of young people, we wanted to make sure that parents could communicate back ABOUT data, to teachers -- and that tutors, teachers, and parents could over time communicate with one another.
| |
| | |
| Finally, we wanted to work to create a free/open source tool so that other districts could adapt what we made. In an era when many districts are strapped for money, it just seems wrong to pay lots of cash just to see basic information!
| |
| | |
| So, we made three views, each designed to support a different conversation. Our administrator and teacher dashboard views present data such as attendance, grades, and MCAS and MAP test scores and growth. The principal wants to try using this view in student support team meetings when people have typically struggled to see patterns in data by hand. Josh wants to use his live, more-often-refreshed view instead of his Excel spreadsheet! In the individual dashboard view, parents and other supporters are encouraged to shape their conversation around Somerville's existing rubrics for student achievement, also making them more attuned to those rubrics. The principal, and Josh, want to try using this view in face to face conversations with parents. Online viewers can also message the teacher from home or work through the dashboard's comment/question boxes; messages show up in the teacher’s email. In our pilot, we will support members of a “team” of family, teachers, and afterschool staff to view the dashboards text boxes and to use text boxes/email to communicate as needed about goals for/progress on student achievement. We’ll also see how the dashboard views can be designed to support face to face communication!
| |
| | |
| ==Process: How did the project change and grow over time?==
| |
| | |
| '''How we realized and redirected things. Two sections, one short and the second long: | |
| ------
| |
| ===Basic History===
| |
| | |
| ''The groundwork needed to support the current work.
| |
| -------
| |
| As we began the OneVille Project, we proposed to create a “dashboard” displaying basic data linking many youth- and child-related databases in the city, because lots of people in the field say that the more data seen by more people, the better. The district was first interested in getting all of its own basic data viewable, quickly -- and that’s what we ended up working on in the end. We bit off a bit more than we could chew at first, especially with all of the other projects we had going: we proposed to link all of the databases in the community, before realizing that this was a) a huge data effort, b) politically very complicated, and c) not clearly necessary at the level of the individual, familiy, teacher, and school administrator (does a teacher actually need to know a student’s police record in order to serve him better?). So, to get started, we focused for the first 2 years on co-designing and producing a dashboard that could work to display school data at the level of the school and the family. SomerPromise, the Mayor's new site-based initiative to provide comprehensive youth services, was also interested in linking databases across agencies and we felt they were better positioned to pursue that goal even as we worked to lay groundwork for the effort by creating administrative and family-level views of school data alone.
| |
| | |
| As it turned out, Greg Nadeau, Somerville resident, had already made an Excel spreadsheet for the Healey Principal the year before we began work on the dashboard. It was an early Excel version of what later became our Administrator Dashboard View.
| |
| | |
| [[Image: greg nadeau view.jpg|greg nadeau view]]
| |
| | |
| So, the main need at the school was entering updated data into it -- by hand. So, Susan, who would later become the lead organizer for the eportfolio project, did some valiant handywork (assisted by colleague Al Willis) to clean up the current year’s spreadsheet and to add new data typically not kept in X2 that the principal also wanted to see, like afterschool enrollment. We also had some regular meetings via phone conference with Greg and the principal to consider the patterns the principal wanted to see and the new "fields" for data that he felt needed to be created permanently in the district student information system (e.g., attendance in the afterschool programs. Afterschool programs weren't keeping this data in Somerville's core data system, X2, and still don’t.)
| |
| | |
| Josh Wairi, a 5th grade teacher at the Healey, got interested in the dashboard design when we stopped by his classroom one day after school. Looking together at his computer and printouts, we realized he was already creating spreadsheets of student data from X2 by hand. He was interested in quickly displaying and sorting basic data, to supplement his face to face and phone conversations with students and parents. His work showed us the need for what would become the “Teacher View,” a class-size version of the school-wide Administrator View.
| |
| | |
| Stories of parents’ own needs to communicate with teachers about their children’s report cards prompted us to push forward on an “Individual View” that included the report card instead of just absences, grades, and test scores. We had been inspired by the New Visions for New Schools project, which had a view that could give parents and students a quick, accurate understanding of how the student was performing on the latter kind of data. https://knowledgebase.newvisions.org/resource/loadresource.aspx?ArtifactId=3298
| |
| | |
| Compared with New Visions' view, ours had the additional feature of allowing parents to comment on students' progress, send these comments to the teacher, and begin a conversation about how to support the student at home and in school:
| |
| | |
| [[Image:new visions view.jpg|new visions]] | |
| | |
| At the time we were designing the “Individual View,” the District was ceasing to assign its elementary students numerical grades, or their equivalents on the typical A, B, C... scale, and moving to a standards-based K-6 report card. So, we made Somerville's new K-6 report card (handed out on paper to families) online and color-coded.
| |
| | |
| [[Image:individual view grades.jpg|individual view grades]]
| |
| | |
| We added statistics about the student’s attendance and MCAS and MAP scores to the Individual View, which also includes the teacher’s quarterly summary comments.
| |
| | |
| [[Image: attendance.jpg|thumb|Individual student attendance: Click to enlarge]]
| |
| | |
| [[Image:test scores.jpg|thumb|individual student test scores: Click to enlarge]]
| |
| | |
| [[Image: teacher comments.jpg|thumb|Individual student teacher comments: Click to enlarge]]
| |
| | |
| As we work to import the district’s translations of the basic report card rubrics, we have considered encouraging immigrant parents to use Google Translate as a first step to translate teachers’ own comments and to write back to teachers about their reactions.
| |
| | |
| ===Communication ahas, implementation ahas, and turning points!===
| |
| | |
| <font color=red>''Over the course of the project, we had the following communication and implementation ahas, and project turning points. This section captures our learning across the project. Learn the story at: [[Dashboard/ahas]]</font color> | |
| | |
| ==Findings/Endpoints==
| |
| | |
| '''Please describe final outcomes and share examples of final products, with discussion! Three sections below: | |
| | |
| ===Concrete communication improvements===
| |
| | |
| ''What is the main communication improvement we made? What new support for young people may have resulted?
| |
| -------
| |
| The prototypes of the administrative, teacher, and individual views are nearly complete. In the fall, we plan to test and modify the admin view with new Healey Principal Purnima Vadhera (she wants to use the view in student support team meetings and to share data patterns with teachers) and to test and tweak the teacher and individual views with Josh and his students’ families. We’ll also support an email-based communication among a "team" of educators, family, and afterschool providers around each student in his class.
| |
| | |
| ===Main communication realizations and implementation realizations===
| |
| | |
| ''At this point, what are our main realizations about improving communications in public education? (Here are our main thoughts on OneVille’s research questions.)
| |
| | |
| ''What big changes would we recommend re. improving the “communication infrastructure” of public education, so that more people can collaborate in student success?)
| |
| | |
| ''What’s the main thing we’d recommend to other communities or schools implementing similar innovations? (What would we expand or do differently were we to do this again?)
| |
| -------
| |
| | |
| '''MAIN COMMUNICATION REALIZATION: Nobody in this day and age should be in the dark about basic progress info on the young people in their lives.
| |
| | |
| Communities able to invest in high-end communication infrastructure just buy expensive tools to help them view and sort their data. What about districts that can't afford this? They keep basic data in drawers; they send requests for data sorting to central administrators and wait. Or, young people fall "through the cracks" -- a gap in basic information and response. Student service should never be held back by struggles to view the most basic of data! Basic data is always a shallow view of the whole student, but it’s part of the “view” -- and these basic indicators tell us some important things about how youth are faring in the school’s terms.
| |
| | |
| And districts shouldn't pay big money for seeing and sorting this data, either.
| |
| | |
| Open source tools save districts money because they don’t have to buy the product itself; districts only have to pay for services (upkeep and troubleshooting the tool), a fraction of the cost. (Our technologist Seth put it this way: “Take the quarterly profit of a company like Blackboard INC (Quarter 1, 2010) and break it down into services and license fees. In just one quarter, Blackboard made only $7.3 million in services, but made $93.7 million dollars in 'product revenues' (licenses to run their software). In the K-12 context, a freely available and documented open source competitor to storebought communication tools would free up a lot of money back to US Schools.”
| |
| | |
| If our tools prove helpful, our next task (or someone else’s) could be to make these adaptable anywhere in the country, and to create a model for supporting districts to use the free tools.
| |
| | |
| '''MAIN IMPLEMENTATION REALIZATION: Overall, we’ve learned that parents, students, administrators, and local technologists can fundamentally help design tools for sharing and communicating about basic data in schools.
| |
| | |
| ===Next Steps===
| |
| | |
| ''What do we plan to do next?
| |
| | |
| As stated above, we’ll be piloting our three “views” this fall and will report out what we learn.
| |
| | |
| Ongoing Challenges: We face the same challenges with the individual view as anyone working to enhance collaboration around students across barriers of income, racial/ethnic background, language difference and tech literacy. Not all parents have home access to computers and internet (though phones with internet access are increasingly popular), and some parents are not functionally literate in their home language. The same work schedules that make parent-teacher meetings hard also make it hard for some parents to coordinate their schedules with the computer labs at local libraries or in the housing projects where some families live. (Also, to look at an online data display together, educators too need internet access -- not always easy if people meet in a room without a computer, wireless, or a laptop to plug into an ethernet cable.)
| |
| | |
| We hope to work with the PTA this year to create a model of parent-parent, basic computer and email training for Healey parents who need this support. We’ll be reaching out to parents in Mr. Wairi’s new class about how to support them to access the Internet. Several years from now, the proliferation of smartphones and iphones will likely shrink this challenge dramatically, making it easier than ever for partners to join the conversation about student data.
| |
| | |
| We also will continue to consider bigger issues about “data” in schools: basic quant data on students is never the whole story, which makes linking a dashboard to an eportfolio even more important.
| |
| | |
| ===Technological how-tos===
| |
| | |
| ''Here's where we describe "how to" use every tool we used, so that others could do the same. We also describe "how to" make every tool we made!
| |
| -----
| |
| SETH ADD HERE
| |
| | |
| | |
| ===Questions to Ask Yourself if You’re Tackling Similar Things Where You Live===
| |
| | |
| ''If you wanted to replicate any of this, what would you need to think about? Contact us to learn/talk more!
| |
| -------------
| |
| Here are some questions to ask yourself if you want to tackle similar things in your school:
| |
| | |
| -Can everyone who needs to get and share important progress information, get and share it when they need to?
| |
| | |
| -If not, what barriers are in the way and how can those be overcome?
| |
| | |
| -Is your district spending tons of money on data display tools to get basic data in front of people?
| |
| | |
| - If so, how could low cost tech support such information-sharing?
| |
| | |
| -To support young people, what “data” should show up on any data display, and why?
| |
| | |
| -What data isn’t found in any “student information system” but should still be known?
| |
| | |
| -What infrastructure would support actual conversations ABOUT "data," between the people who share young people? Which conversations should happen in person and which could be supported online? Could you do an experiment where you live to test which works for what?
| |
Written by Mica Pollock and Jedd Cohen for the dashboard project, with initial dashboard development by Somerville technologist Seth Woodworth and next development for piloting by David Lord of San Diego
Click here for the Overview and key findings on this project; click here for the Expanded story on this project.
What communication challenges did this project address?
In diverse districts across the country, administrators, teachers, and approved service providers are often unable to quickly review patterns in basic data affecting students – like trends in their absences, test scores, grades, and credits. This is often due to the high cost of cutting-edge student data systems (or, the high cost of professional development showing educators how to use the systems they have). Families, for their part, are often unsure how to find all the relevant data on their children, how to read data once they are given it (e.g., a report card), and how to communicate with schools about it. (see http://nationalpirc.org/engagement_webinars/webinar-student-data.html). As both educators and parents know, gaps in available basic data also can create gaps in student service, because people in charge of supporting young people remain unaware about some key aspects of their situation. How are speakers of language X doing on standardized tests? Who is enrolled in which afterschool program? Was Jose's absence rate over the past semester unusual?
In Somerville in 2009, teachers and administrators said they couldn’t easily view or sort patterns in student data because that data was buried in different “fields” in the student information system (SIS), which Somerville couldn’t afford to replace or fundamentally upgrade. Over the past two years, several local technologists, a teacher, and several researchers have been working with the teachers' families, related afterschool providers, and two principals in the Somerville School District to help design and create "dashboard" tools using open source software (free software that any developer can adapt).
A "dashboard" is a quick, visually simple view of student data, all in one place. Our "dashboards" are designed to let (appropriate) viewers go to a single place – on the web – to find and sort comprehensive data on each student, class of students, and the entire school. Particularly in designing our "individual view" (which would display an individual student's data to student, parent, teacher, and approved service providers), we’ve been working to design a tool that not only displays basic data on students, but also launches a focused conversation among stakeholders about that data.
The first dashboard below (our "administrator" and "teacher" view) shows educators data on a school or classroom of students. The "individual view" dashboard beneath it shows data on an individual student to student, teachers, parents, and approved afterschool providers. This view also allows these people to communicate with each other through the “comment boxes.” (Names are fictional to preserve anonymity.)
On the OneVille Project, the dashboard was one of six subprojects and our first effort to create a tech tool totally from scratch with young local technologists. Development with our Somerville colleagues took more budgeted hours than any of us originally anticipated, and after some excellent pro bono work by David Lord of San Diego, by Spring 2012 we were about 60 development hours from pilot-readiness on the admin and teacher views (and roughly 300 hours from pilot-readiness on the individual view). Remaining work: to finish tweaking the final programming "tubes" linking the dashboard to Somerville's Student Information System so that data could be displayed 100% glitch-free. The "code" for all of the dashboard views is linked on the Overview and key findings page and to date is the core "product" of this pilot. Open source code also means that any developer anywhere can develop on the product we made. For example, community youth-serving and university outreach orgs needing to view and sort youth- and student-related data have expressed interest in a similar free product developed for their specific needs. See the Overview and key findings and Expanded story pages for the full story of developing this tool.
Why is it important to improve communications?
What we found:
- ¡Aha! A gap in student data equals a gap in service.
- ¡Aha! One-Stop Shopping: People say it's crucial to be able to see different kinds of student data at the same time, in a single display -- and, be able to sort that data to check for patterns.
- ¡Aha! Open source data tools could save schools across the country significant costs, IF design goes fast enough, IF community users are ready to use the tools, and IF tech support for open source tools remains available locally.
- ¡Aha! In addition to having the ability to quickly see and sort such basic data, diverse partners in young people’s lives need supports to communicate ABOUT basic data.
How do the dashboards work? How might they be designed?
How do you know if your school could improve communication?
Questions to ask about the current system in your school:
- ➢ To support young people, what “data” should show up on any data display, and why?
- ➢ How does your school make data on students visible to school administrators, classroom teachers, and afterschool providers? And how about parents? Which necessary data is readily available, and which isn't?
- ➢ What infrastructure would support actual conversations about "data," between the people who share young people's lives?
- ➢ Which conversations about data should happen in person and which could be supported online? Could you do an experiment to test which works for what?
- ➢ What data isn’t found in any “student information system” but should still be known? By whom?
- ➢ Is your district spending tons of money on data display tools to get basic data in front of people?
- ➢ If so, how might low cost tech development or professional development on the tools you already have support such information-sharing?
- ➢ ***How can you ensure resources for ongoing tech modifications and tech support after you have developed your initial tool?
The Next Layer: Connecting to Folks Doing Similar Work in Other Communities.
We'd love to spark a lively exchange between people working on similar things.
Want to talk further?
Are you working on improving communications in your own school or community?
Contact point people for the dashboard project directly at:
Jedd Cohen (jic378@mail.harvard.edu); Mica Pollock (mica.pollock@gmail.com)
Click here for the Overview and key findings on this project; click here for the Expanded story on this project.

